To improve 3.4L engine performance. I have had the 3.4L engine in for a while and I have made small attempts to tune it. I will make a serious effort to increase performance with measuring what is happening at the ECM.
Each time I go some where in my fiero I will take my laptop and connect it up and log the data. I have written a small program to put a time stamp infront of each entry. The time stamp is milliseconds since the start of the data logging.
Feel free to look at and help me evaluate the data below. If you have insights on some change you think I should make send me e-mail
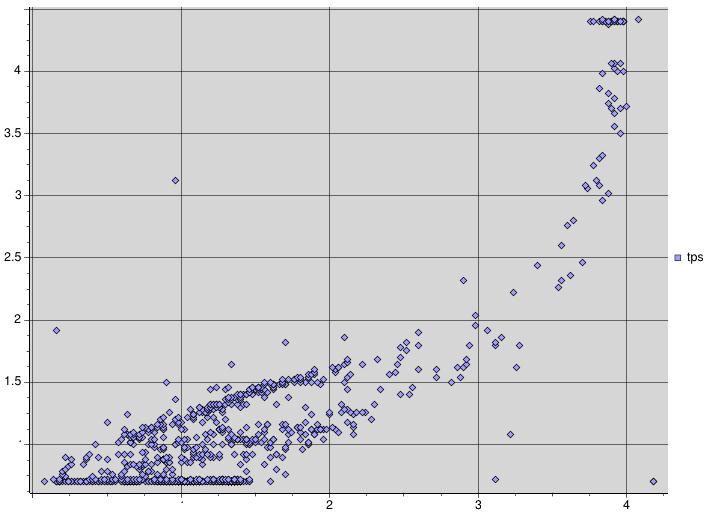
A plot of tps vs. map. This shows that the fiero intake is indeed not flowing enough air. As seen in the plot the engine is keeping the same vacum level from a little past half tps to full tps. This matches with the feel of driving the car. From half throttle to full throtle there is very little change in power.
| %CO2 | %O2 | HC (PPM) | CO(%) | NO(PPM) | |||||||||
| Test | rpm | meas | meas | max | ave | meas | max | ave | meas | max | ave | meas | result |
| 15mph | 1871 | 14.9 | 0.3 | 221 | 45 | 14 | 1.13 | 0.20 | 0.0 | 2177 | 530 | 816 | PASS |
| 25mph | 1871 | 14.9 | 0.3 | 206 | 23 | 15 | 1.03 | 0.09 | 0.00 | 1977 | 368 | 820 | PASS |